The Production Plan Formula
This section describes the formula that the
'Create Production Plan' Maintenance function will use to calculate the quantities in
Production Plans. These are the quantities of each Item that you need to produce in order to meet
Sales Forecasts and, if you are using
Stock Policies, to ensure the required quantity of each Item remains in stock at the end of each week or month.
Before using the Maintenance function to create a Production Plan, you can produce a Create Production Plan - Preview report to see a list of the Items that will be included in the Production Plan together with quantities. In the report there will be a [See Detailed Calculations Behind] text button: click (Windows/Mac OS X) or tap (iOS/Android) this button to open a more detailed report showing how the formula was used to calculate each quantity. Each step in the calculation will be shown.
Illustrated below is an example 'Create Production Plan - Preview' report:
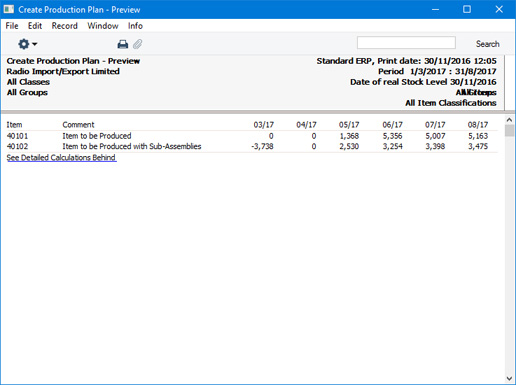
Click or tap the [See Detailed Calculations Behind] text button to see the calculation in detail:
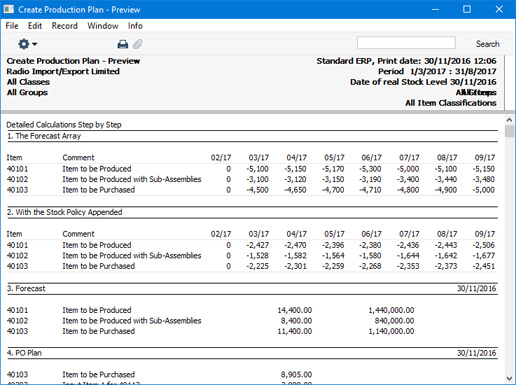
This detailed report illustrates each step in the calculation formula individually. The stages are as follows:
- Step 1: The Forecast Array
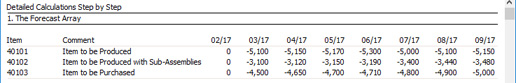
- The first stage in the calculation is to establish the sales forecast figures for each Item. These are taken from records in the Sales Forecast register that have been marked as OK.
- In the detailed report, this section will include a column for the week or month after the report period (space allowing).
- If you need a report that only shows these figures, use the Basic Item Requirements report.
- Step 2: With the Stock Policy Appended
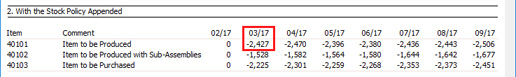
- The Stock Policies setting contains minimum and maximum start-of-period stock levels for each Item, expressed as a number of days' sales. This step in the calculation formula uses that setting and the sales forecast figures to calculate the quantity of each Item that you should have in stock at the beginning of each week or month. When you produce the report or run the Maintenance function, you will be able to specify whether this calculation will use the minimum or maximum stock level in the setting. Please refer to the Stock Policy - Average Sales per Day page for details about this calculation.
- If an Item has no Stock Policy, it will be assumed that the stock level should be zero at the beginning of each week or month (i.e. having no Stock Policy and having a Stock Policy with zero values amount to the same thing).
- If you choose "Neither" as the Stock Policy in the specification window when printing the report or running the Maintenance function it will be assumed that the stock level at the beginning of a week or month should be the full Sales Forecast figure for that week or month. In this case, this step will not be shown in the report, but the figures will be visible in step 10.
- Referring to the illustration above, the figure for Item 40101 for March is -2427. This means that there should be 2427 units in stock at the beginning of March.
- If you need a report that only shows these figures, use the Stock Levels based on Stock Policy report.
- Steps 3-6
- When you produce the report or run the Maintenance function, you might not know the exact stock level of each Item at the beginning of the period, probably because you are producing the report or running the Maintenance function ahead of time. You will therefore need to specify the date when you know the stock figures to be accurate (the "Date of Real Stock Level"). If the Date of Real Stock Level is earlier than the beginning of the period, the calculation formula will estimate stock levels on that date using the relevant Sales Forecast, Production and Purchase Order Plan figures. Steps 3-6 represent this part of the calculation.
- For example, the report period begins on March 1st, and you know that stock level figures are correct on the date when you are running the report, the previous November 30. Enter this date as the Date of Real Stock Level in the report specification window. The report will estimate stock levels for March 1st, displaying the calculation in sections 3-6 as follows:
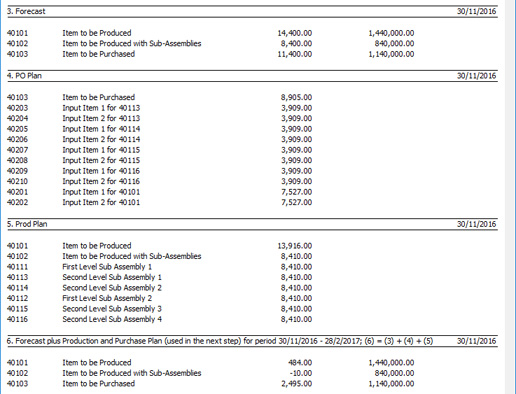
- Step 3: Forecast
- Estimated sales figures for November 30 - February 28 (February 29 in a leap year), calculated using the Sales Forecast records for November - February.
- Step 4: PO Plan
- Estimated goods-in figures for November 30 - February 28, calculated using the Purchase Order Plan records for November - February.
- Step 5: Prod Plan
- Estimated production figures for November 30 - February 28, calculated using the Production Plan records for November - February.
- Step 6: Forecast plus Production and Purchase Plan
- Step 3 - Step 4 - Step 5 (i.e. the net change in stock levels for the period November 30 - February 28 (or 29)).
Steps 3-6 will not be displayed in the report if the Date of Real Stock Level is the same as the beginning of the report period.
- Step 7: Current Stock
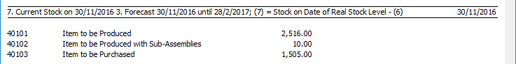
- The actual or calculated stock level of each Item at the beginning of the report period. This is calculated as the stock level on the Date of Real Stock Level less the figure in Step 6.
- Step 8: With the Stock Level and Forecast Appended
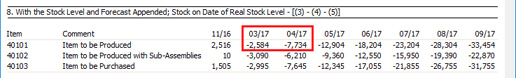
- This step calculates the stock level at the end of each week or month by subtracting the Sales Forecast for that week or month from the stock level at the beginning of that week or month. In other words, it is the quantity that needs to be produced to satisfy the Sales Forecast.
- In the example illustrated above, the figure for March for Item 40101 is -2584 (i.e. the stock level at the beginning of the report period (2516 from Step 7) less the Sales Forecast (5100)). The April calculation begins with the -2584 figure (stock level at the end of March) and subtracts the April sales forecast of 5150, producing -7734. This is shown as a negative figure, indicating that the Sales Forecast figure cannot be met from stock.
- Step 9: Next calculation will take Projected Stock Levels from Previous Month
Reprints step 8.
- Step 10: Minus: Stock Policy for next month
Reprints step 2.
- Step 11: Minus: Forecast of this month, resulting in:
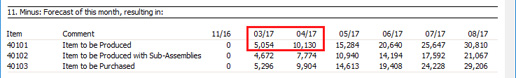
- This step calculates the quantity of each Item that you need to produce to meet both the Sales Forecast for the week or month and the Stock Policy requirement for the next week or month. It subtracts the Stock Policy requirement for the next week or month from the Step 8 figure for the week or month.
- In the example illustrated above, the Stock Policy requirement of Item 40101 for April is 2470 (from Step 2). This means there should be a quantity of 2470 in stock at the beginning of April. At the beginning of March, the stock level is 2516, and March's Sales Forecast is 5100. It is therefore necessary to produce 5054 (2470 - 2516 + 5100) to meet this target.
- Continuing the example, the Stock Policy requirement of Item 40101 for May is 2396 (from Step 2). This means there should be a quantity of 2396 in stock at the beginning of May. At the beginning of April, the stock level will theoretically be 2470 (from the Stock Policy for April), and April's Sales Forecast is 5150. It is therefore necessary to produce 5076 (2396 - 2470 + 5150) to meet this target. The figures in section 11 are accumulated: 5054 + 5076 = 10130.
- If this figure is negative, this indicates that the Sales Forecast and the Stock Policy requirement for the next week or month can be met from stock and therefore there is no production requirement. The Item will then not be included in the Production Plan for the week or month by the 'Create Production Plan' Maintenance function.
- Step 12: With the Purchase Plan Appended
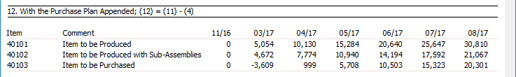
- If you have already created and marked as OK a Purchase Order Plan for a week or month, this step will subtract the quantities in that Purchase Order Plan from the figures in Step 11.
- Usually the existence of a Purchase Order Plan will not affect the quantities in a Production Plan. It will only do so if you have decided to purchase Items that you normally produce.
- Section 13: With the Production Plan Appended
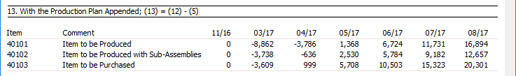
- If you have already created and marked as OK a Production Plan for a week or month, this step will subtract the quantities in that Production Plan from the figures in Step 12.
- This suggests that running the 'Create Production Plan' Maintenance function again will create a second Production Plan for the same Items for the week or month in question, effectively creating a supplement to the original Production Plan. In fact the Maintenance function will mark the original Production Plan as Closed and will create a new Production Plan for the entire requirement (providing no Productions or Production Orders have been created from the original Production Plan: if they have, the Maintenance function will do nothing).
- Section 14: But first appending assumed correct monthly plans
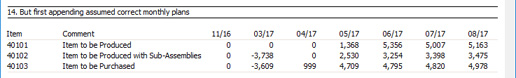
- Steps 8-13 in the report will display accumulated figures from period to period (i.e. from column to column). These figures are the accumulated effect on stock levels of the Sales Forecasts and the Stock Policy requirements.
- Step 14 separates the accumulated figures into individual weekly or monthly production and purchasing requirements. Negative figures in Step 13 will be set to zero: negative figures indicate requirements that can be satisfied from stock or from existing Production or Purchase Order Plans. Where the quantity is zero, the 'Create Production Plan' Maintenance function will not include the Item in the Production Plan for the week or month.
- Step 15: Final Results
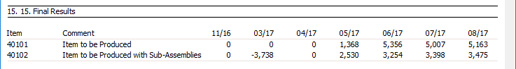
- This step shows the quantity of each Item that you need to produce.
- While the previous steps were calculated for every Item in Sales Forecasts, this step will isolate those that can be produced (i.e. those that have Recipes) from those that will be purchased.
---
The Calculation Formula in the MRP module:
Go back to: